Some visualisation helps
This week: Web domain woes; Some visualisation helps; Colourisation; COVID-19; La Niña; Autumn fruits and flowers; Another failure;
I’m still recovering from the change in the clocks last Sunday morning.
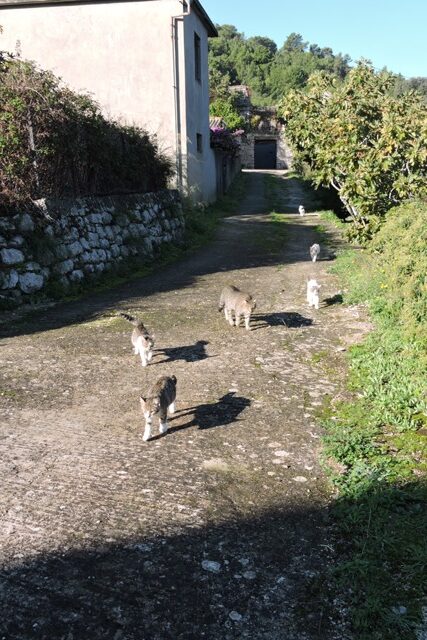
The felines haven’t worked out that everything is an hour later. They are still waiting for food at the usual “getting up” time in the morning, and coming to tell me about it at 05.30!
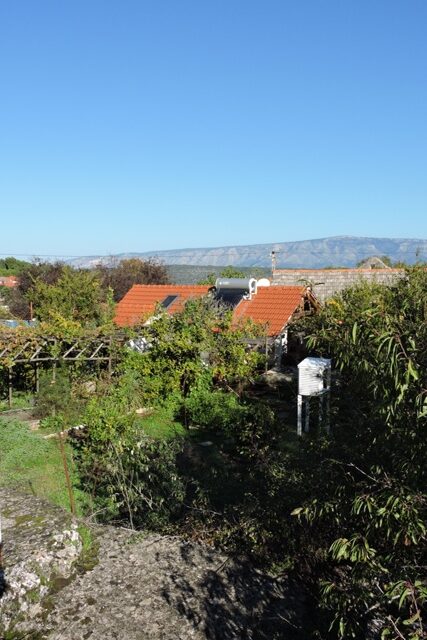
It is nice though going for a walk as soon as the sun is up, even if we all come back covered in overnight dew from the wet grass.
It’s now dark by 17:30 on a light night and earlier if there is heavy cloud.
So as I write this after tea, although the clock is telling me one thing, my body clock (and the kittens) are telling me it is time for supper and bed!
Roll on March when we change back…
Web domain woes
I am surprised by the volume of attacks that are mounted on the blog through my domain. I have installed some fairly sophisticated software to detect and deny access to attackers who are trying to find the passwords.
What they want to do is to take over a web domain and then use it to host their own illegal material, all at the cost of the domain owner.
On any given day I will have a dozen or more attempts to log in.
Then last week, within 24 hours of posting the blog, there were twenty attempts to post replies, all advertising illicit medicines and drugs and acting as “click bait”.
As I received a warning from another piece of software, I turned off comments. That stopped the people trying to post, but at the expense of legitimate responses.
There is a lot of work involved in keeping even simple websites free of the plague of viruses and malicious advertisements!
In one sense it is because the larger and commercial websites are now so well protected, that the spammers and jammers are turning their attention to small domains, where the security may be less and it is easier to “break an entry”.
It is all about trying to keep one step ahead…..
I’ve finished my Dundee University course this week and as a project I completely re-thought the data from my weather station:
How can I make it widely available via the domain and what use would it be to people.
There was a lot of work involved in linking all the annual data worksheets, but with the hard work done, so it becomes easier now to draw in more information as a graphic.
Since finishing, I have been reading up again on climate zones.
Sunset Magazine, based in Menlo Park, California, has done an incredible amount of statistical analysis, down to post code (ZIP code) level.
I know that I am in Zone 21, a thermal belt. But just 200 meters away, down slope, from my Dol house, the zone is 19 – Significantly cooler in winter.
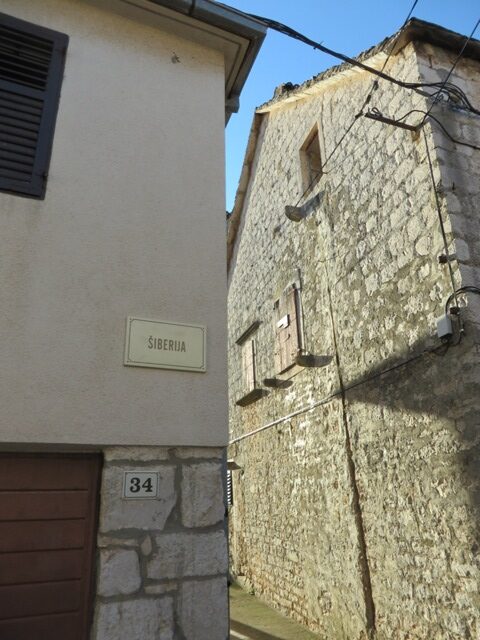
And five kilometres down the road in Stari Grad, where Cvjetko lives, the street name is “Šiberia”. He will set off from home in freezing fog and a temperature of -5º and get to Dol in warn sunshine and it will be +8º.
I have now realised I need to add two more bands to the chart. One to calculate the number of cooling nights where the temperature is below 4ºC, and the number of days when the temperature is above 30ºC.
So I have a job for the dark evenings next week.
Some visualisation helps
Four weeks ago in my blog called The last Kiwanos on the 10th October, I wrote about starting my latest FutureLearn course, called “We Observe” run by Dundee University.

I should add that I earned my first degree whilst in the police from the University of Life (Humberside campus). I followed this with my higher degree from the University of Hard Knocks.
When I was working for the UAE Government, where everyone was expected to have a degree, the HR Department assessed my commercial helicopter pilots licence as being of equal standing to a BSc.
I think the study for examinations which have to be passed to obtain a CPL, are just as hard, and the actual oral and practical flight examination I’m told are like the formal presentation of a thesis.
One part of the oral examination I vividly recall is the examiner showing me a model of a particular helicopter, but the rotor blades had been reversed. I was then asked on this particular aircraft, which way do the blades rotate.
It’s all about seeing, having a depth and level of knowledge of individual aircraft and their characteristics, and not just looking and answering the question.
I won’t bore you with a description of the examiner shutting down the aircraft engine while we were flying, to see what I would do…. Well, I’m still here!
The “We Observe” course has been about challenging participants to think differently about dealing with statistical data.
Over the past six years of blogging, I have included regular graphs and charts from my weather station, but the course got me thinking about visualisation and how to better present data.
The question is who would benefit from more detailed data and how do you present it in a better, more easily understood way.
So during some wet weather this last weekend and early in the current week, I have been working intensively on my spread sheet, adding formulas and creating new formats.
This is to try and make more sense of the hundreds of thousands of readings that my weather station has recorded.
Here is the finished result.
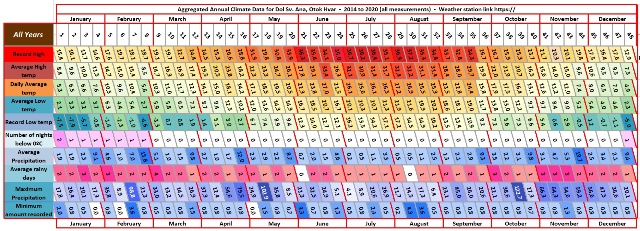
But although this look nice, it took a while to get there and it also threw up some anomalies which I had never noticed in the data.
Vision is the keenest of the human senses, but looking at row upon row of numbers, you cannot always see the ‘wood for the trees’.
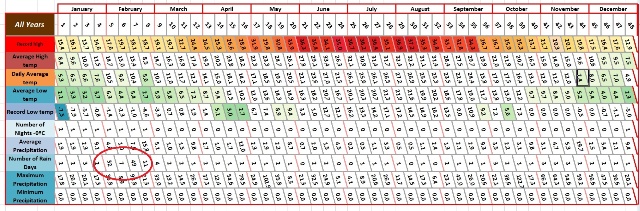
Some glaring errors stand out, like the weeks with more than seven rainy days.
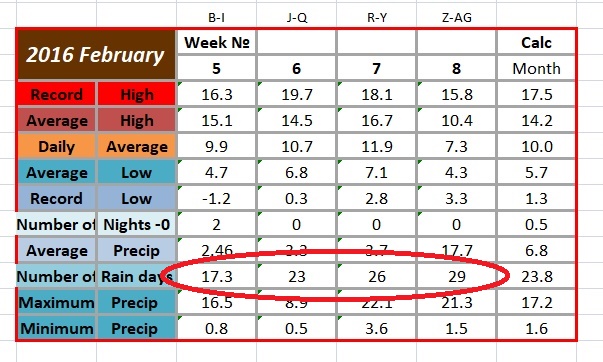
This wasn’t a data error. I tracked this down to four cells in one table where the calculation was one number adrift in each cell.
It was completely down to me as the programmer, entering a bad formulae.
That error was easily corrected. But some other anomalies were much more difficult to spot.
Colourisation
Once you start to add colours, patterns begin to emerge.
I looked at the online weather resources to see if there was a standard colour code scale for showing differences in temperature.
It seems there isn’t, with the WMO making no recommendations.
There is also no standard for how many degrees of temperature there are between each scale change.
I found that there can be 2, 3, 4, 5 or 6 degrees in each block. I went with a four degree grouping.
To select the different colours to delineate between temperatures, I used two online resources.
The first was a set of Pantones, and the second converted individual Pantone colours into shades of red, green and blue. These were then applied to represent the temperatures in my chart.
What was more difficult was to create colour breaks for things like rainfall, where the difference between the lowest and highest values was not especially large.
Once I started assigning colours to the chart, I could see some more figures which were clearly wrong, for example the very low minimum temperatures for weeks in June.
These I tracked back to single cells in one line of a large workbook, where I had incorrectly entered a single number. In one case it was 1.1 instead of 11.1.
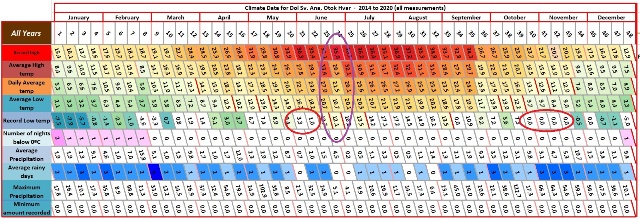
Of more interest is week 24, the last week of June, where temperatures are significantly lower than the weeks on either side.
When I went back and looked at the data, I found that in five successive years, this week of the year has had lower temperatures.
Just to make sure it wasn’t an error, I went back to the source data from my weather station. It wasn’t. I had entered the data correctly.
So that leaves an unanswered question: Why is this particular week of the year, immediately after the summer solstice, cooler than the weeks on either side? I have no answer for that particular question.
Now that I have all the data organised in this way, I will be able to do other manipulations to see if there are any interesting patterns, or anomalies, which need further investigation.
COVID-19
I was asked this week by the Vet if I was afraid of the COVID virus (Isabijela has been for her second and final round of annual virus injections). Quite truthfully I answered that no, I’m not afraid, but I am going out of my way to try and avoid it.
I have several projects that I would really like to be getting on with, but I need to go to Split, to Bauhaus for supplies.
Here on the island, I cannot get some of the materials I need and the fiasco over the central heating corrosion inhibitor is an example of local orders being a complete failure.
I have some Melamine covered MDF that I want to make into storage shelving, however cutting melamine without chipping requires a particular kind of circular saw blade.
It needs to have a lot of very fine, sharp teeth. When I went through my box of spares, the only one I have is quite a way past its use-by date and of course I can’t get one here.
In Croatia the number of COVID cases are increasing at a significant rate, with the number doubling every two weeks. Split is one of the areas where there are a large number of infections.
I was last in Split at the start of December last year and because of the threat of the virus, I have not been since. Out of an abundance of caution I continue to avoid going, even if it means not being able to finish some jobs.
The official advice is that if you don’t have to travel, then you shouldn’t and the all day trip to Split and back, on a ferry where social distancing cannot be guaranteed is in my view non-essential.
The result it that the list of jobs is backing up, all in needs of “things” from the mainland…
The number of sellers on eBay who will post here seems to be diminishing too. I can always find things I want easily, then you have to find a seller who will post to Europe and also pay the exorbitant costs they charge for postage and packing.
So for now, I think I will forgo the visit to the mainland and maintain my social distancing…
La Niña
Continuing with my earlier weather theme I, like many people, am curious about what the winter has in store and what I need to prepare for.
Do I cut more timber for the wood stove or will the timber I already have be enough?
The answer probably lies in the Pacific Ocean.
I have been following reports of a growing La Niña event. In technical weather speak this is an ENSO (El Niño Southern Oscillation).
El Niño and La Niña are Spanish for “the boy child” and “the girl child” – so opposites. El Niño is a warming of the surface of the Pacific Ocean, while La Niña is a cooling event. It is the latter that we are in the middle of at the moment.
This image produced by NOAA shows the current cooling event. NOAA Oceanographers and scientists anticipate that the cooling will continue throughout the northern hemisphere winter and early spring of 2021.
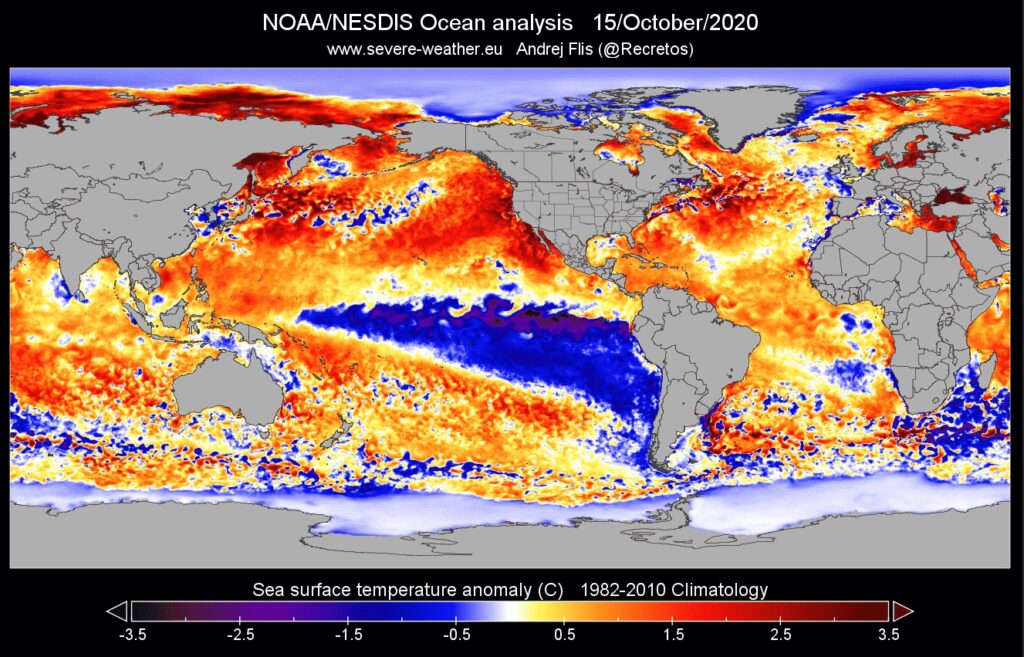
The weather across Europe is linked to the North Atlantic Oscillation, which is connected to ENSO by the jet stream.
There is quite a long, but non technical description of how all this works on the Severe Weather Europe website. It’s worth a read if you are interested.
Also of interest is the Arctic Ocean which has not started to freeze, as would be expected in a normal October.
Whilst Severe Weather Europe has done some modelling on what the winter weather in this far south eastern corner of Europe was like during past La Niña events (it was colder than normal), what they cannot add into the modelling is a warmer Arctic, because it didn’t exist in previous years.
With so much uncertainty, I think I might just cut a bit more firewood next week, so I have an abundant supply, just in case….
Autumn fruits and flowers
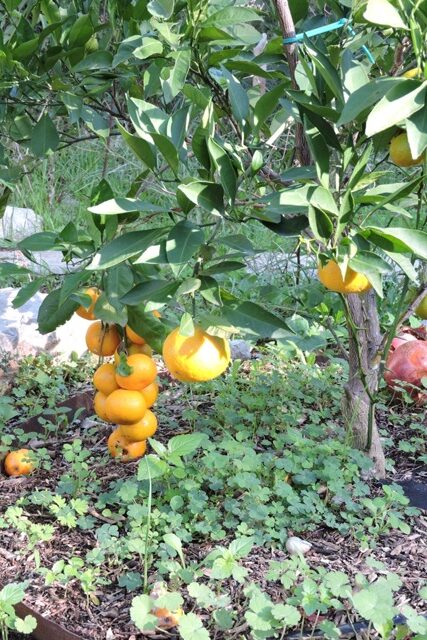
In the citrus orchard the Mandarins are ripening and are about ready for picking. I have three varieties, so I have fruit spread across the five months between November and March. These are an early variety.
This autumn has been the best ever for my white Buddleja Davidi. I have never had as many flowers as are on it this year.
It is in flower much later than you would see it in more northern latitudes and on Saturday morning I counted eleven Red Admiral butterflies simultaneously feeding on the flowers.
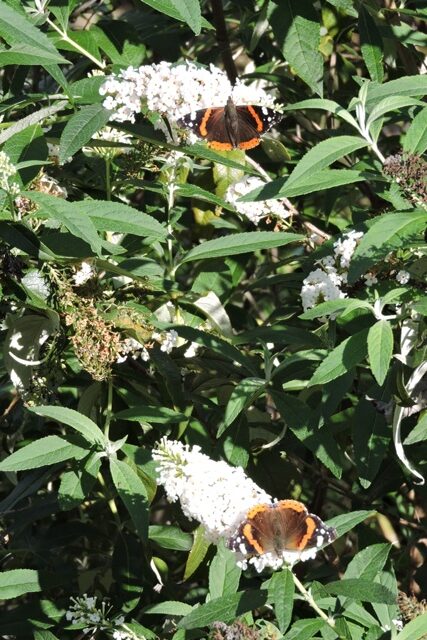
During the summer, flowering Budleija here do not attract very many butterflies, but it seems that in the autumn, when many Mediterranean flowers have begun to die back, it is providing food for our Red Admirals.
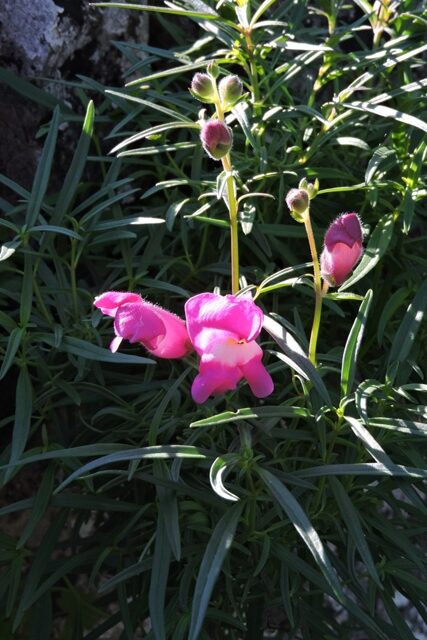
I also have some wind sown Snap Dragons in flower in one of the dry stone walls. I’ve not attempted to seed any, so they have found a niche on their own.
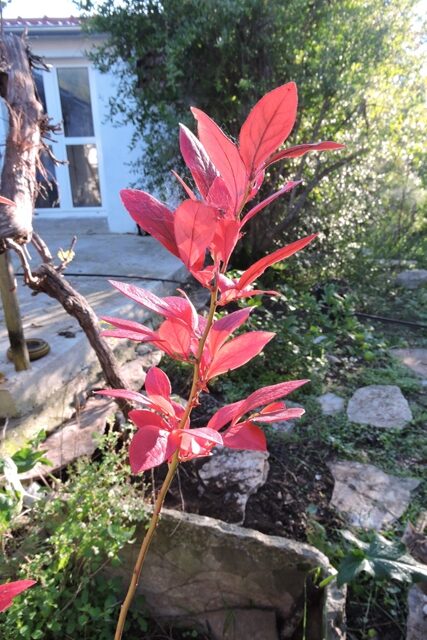
There are also plenty of leaves changing to their striking autumn colours now too.
Another failure
Not everything I plant around my home thrives. Sometimes there are failures even after their success seems assured.
I planted a plum tree in the Drupe orchard and for a couple of years it has grown well. However this spring, although its buds burst, the leaves were small and quickly turned brown.
I did the usual investigation to see if I could see what was wrong. Nothing appeared to be eating the tree, at least not above ground where I could see. It seemed to be moist and had come though a not especially cold winter.
By summer it was obvious that what ever it was that was causing the problem, it was terminal. There were no leaves and rubbing a bit of bark away did not reveal any green cambium.
It was deceased, although it didn’t look diseased.
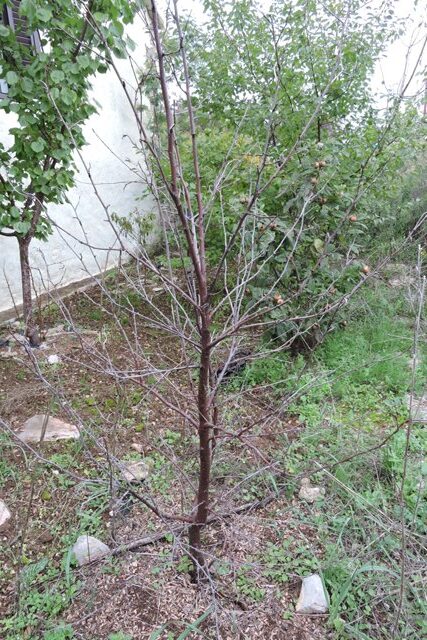
With fine weather this week, I cut back the small twigs and set them aside to shred and make into mulch. Then I removed the layer of mulch around the base which had been acting as a weed suppressant.
Peeling back the weed matting, there did not appear to be anything wrong with the root system, although it was perhaps not as extensive as I might have expected for a sapling I planted three years ago.
With little difficulty I dug it out, so that suggests that for some reason it had not thrived and developed a comprehensive root system.
It is in the row closest to the the bedrock wall of the orchard and whilst I don’t know how deep the soil is here, I suspect it is not especially deep and I know it is not the best quality.
I already have an apple tree to replace it – there are already eight varieties of apple planted in the orchard – but I dug out the soil around in case there are nematodes or fungi which had attacked the roots.
With fresh soil around the root ball of the apple tree, I planted it. There is an underground irrigation pipe already in place which I tested before replacing the weed matting and the mulch.
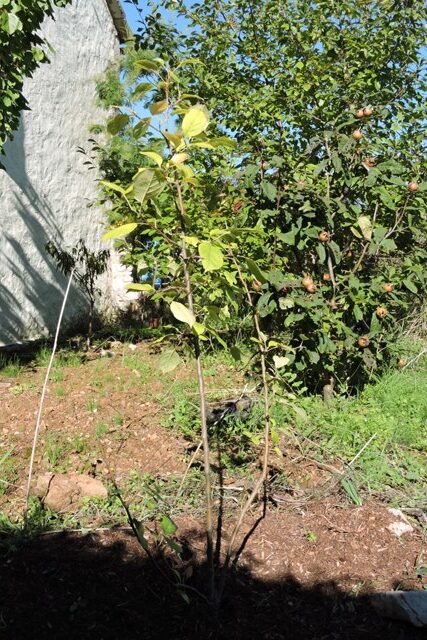
I hope I have a bit more success with this apple tree than I had with its plum predecessor. NCG
One Response
Elizabeth B
Love the photo of all the cats. You will become ‘The Cat Man’ before you know it!
Shame about your plum tree. This can happen, which is why we try to get landscape scheme clients to retain the landscape contractor on a five year maintenance period, particularly if there are trees involved. As you have found, trees can die after two or three years and if there is only a single year maintenance period the client is left with the cost of replacement. It might be worth referring back to something like the RHS growing advice. I am wondering if your little tree might have found pH levels that it didn’t like or the root ball might have become waterlogged from the watering system? Once tree roots grow out of the immediate planting zone they can find conditions that they don’t like and that can have detrimental effects. Such a shame but we all learn from our failures… all good gardeners have failures.
A smaller example, I was given a Blueberry bush by Vivienne for Mother’s Day one year. As we tend towards alkaline conditions, I decided to keep it in a pot. All went well until I repotted it into a larger container. Without thinking, I used a moulded concrete-type pot that happened to be the right size and was empty. All was well until the roots hit the walls of the pot. It slowly declined but by the time I realised what was happening it was too late. I transferred it out immediately I had become aware, and washed the roots in rainwater, but it was too late – it carried on and died.
Vivienne sweetly replaced it the following year with a note “Don’t kill this one”! Lesson had been learnt! This one is still with me, some years on, and thriving – in a clay pot!
Sometimes we humans can miss the minutiae of needs of our plant friends.
Take care and stay well. Boris has decided to lock the U.K. down a bit more… joy!